
In the era of Industry 4.0, predictive maintenance has become a game-changer for manufacturing and industrial operations. By continuously monitoring equipment health, businesses can anticipate failures before they occur, avoid costly downtimes, and optimize performance. One of the most powerful tools enabling this is the Fast Fourier Transform (FFT) — a technique that transforms vibration data into meaningful frequency insights.
What is Predictive Maintenance?
Predictive maintenance (PdM) is a strategy that uses data collected from sensors (like vibration, temperature, or sound) to monitor the condition of equipment in real-time. Instead of reacting to breakdowns or following a fixed maintenance schedule, PdM allows maintenance only when needed — just before a fault occurs.
Why Vibration Analysis?
Every rotating or moving machine generates vibrations. These vibrations have distinct frequency patterns. When parts like bearings, gears, or motors start to degrade, they introduce new, unusual frequencies in the signal — often well before a failure is visible.
By analyzing these frequency patterns, we can detect:
- Bearing wear
- Misalignment
- Gear mesh faults
- Imbalance
- Looseness
- Cavitation in pumps
The Power of FFT
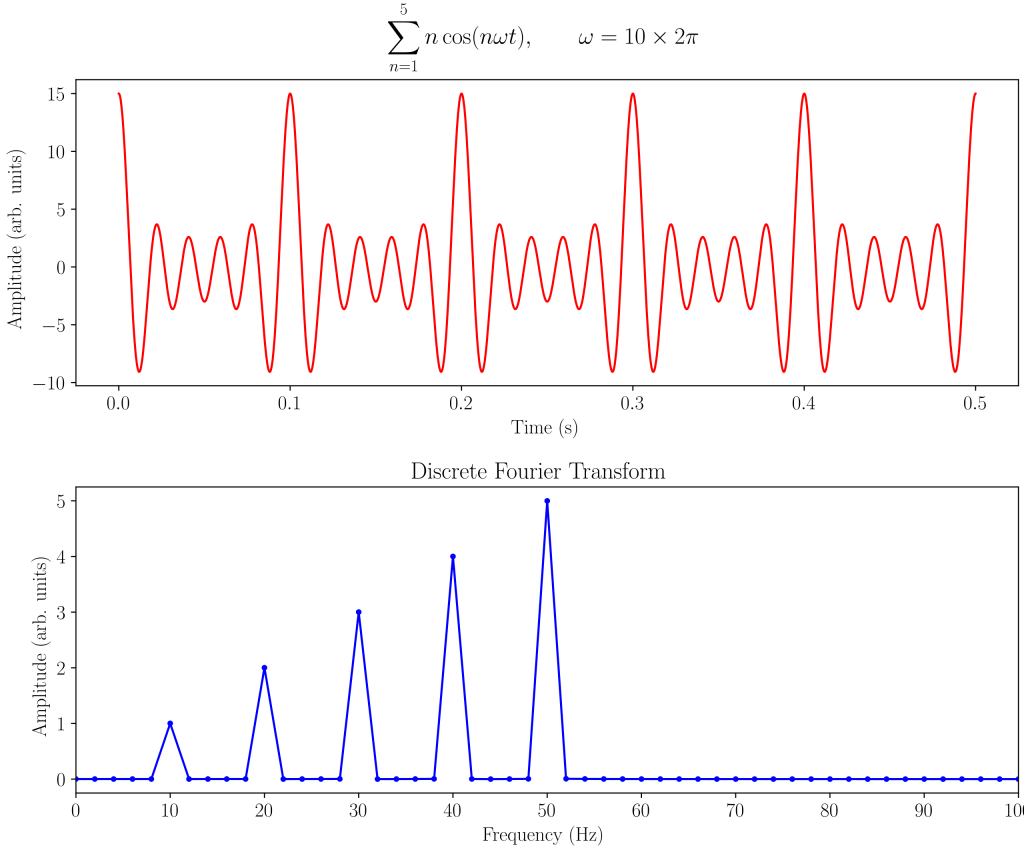
The Fast Fourier Transform (FFT) is an algorithm that converts a time-domain signal (e.g., vibration over time) into its frequency-domain representation. This reveals the hidden frequencies within your signal — like a fingerprint of your machine’s condition.
Instead of just seeing “something is vibrating,” FFT lets you know what frequency it’s vibrating at, which often directly correlates to specific mechanical issues.
Sampling Frequency (Fs) and Nyquist
To digitize an analog vibration signal, we sample it using an Analog-to-Digital Converter (ADC). The rate at which we sample is called the sampling frequency, denoted as Fs (in Hz).
But here’s the catch:
To capture a frequency component of f, you must sample at least twice as fast: Fs ≥ 2f
This rule is called the Nyquist Theorem, and the Nyquist frequency is defined as:
Nyquist Frequency = Fs / 2
If your sampling frequency is 20,000 Hz, the highest frequency you can reliably detect is 10,000 Hz.
What is Aliasing?
If you sample too slowly — below the Nyquist rate — high-frequency components can masquerade as low-frequency ones. This is called aliasing, and it can completely corrupt your analysis.
The cosine wave example
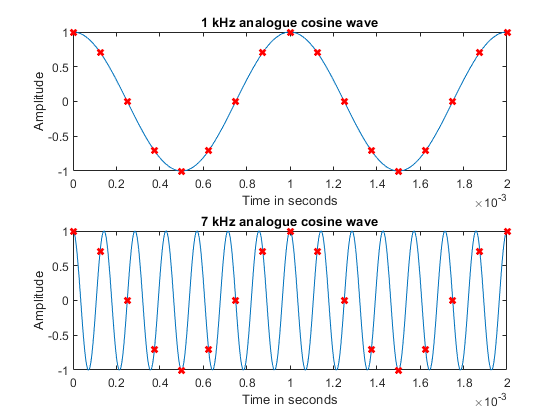
If we take an example of two analogue cosine waves, one with a frequency of 1 kHz and the other with a frequency of 7 kHz. These cosine waves have then both been sampled at 8 kHz – the sampling points are represented by the red crosses:
Now if we take away the original analogue signal and just plot the sampled digital signal:
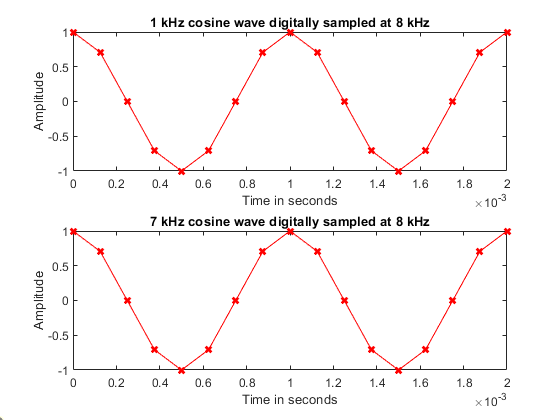
It can be seen that the 1 kHz cosine wave still bears a resemblance to the original analogue version, but the 7 kHz cosine wave has changed! Worse, it appears identical to a 1 kHz cosine wave, it’s alias.
If we apply the Nyquist theorem to our 1 kHz cosine wave, 1 kHz x 2 = 2 kHz, we can see that 2 kHz is less than the 8 kHz sampling frequency that was used, therefore according to the Nyquist theorem, the 1 kHz signal is sufficiently represented.
If we apply the Nyquist theorem to our 7 kHz cosine wave, 7 kHz x 2 = 14 kHz, we can see that 14 kHz is higher than the 8 kHz sampling frequency that was used, therefore according to the Nyquist theorem, the 7 kHz signal will not be sufficiently represented, and that’s why we don’t see a 7 kHz signal after sampling.
How to prevent aliasing?
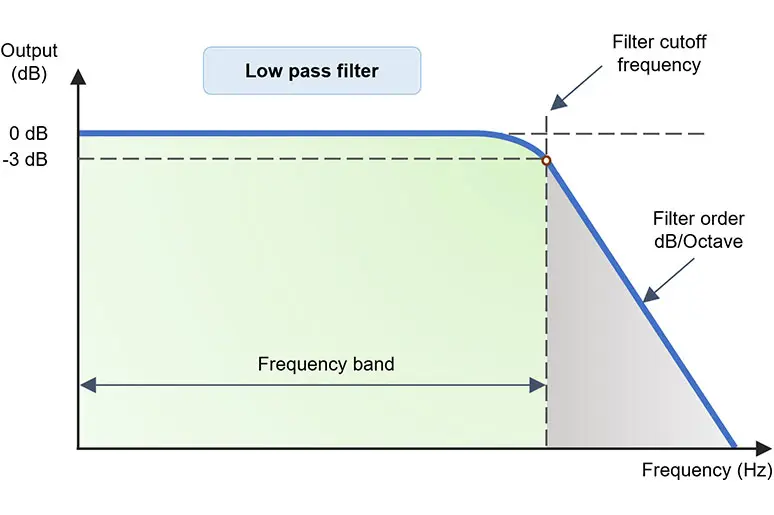
✔ Use a low-pass anti-aliasing filter before your ADC
✔ Ensure your Fs is at least twice the highest frequency you care about
Real-World Example
Let’s say you want to detect faults in a motor where bearing frequencies may reach up to 12,000 Hz.
Step-by-step:
- Target frequency: 12,000 Hz
- Set sampling frequency (Fs): At least 24,000 Hz → safer to choose 40,000 – 50,000 Hz
- Use an accelerometer like the ADXL357, which supports high bandwidth and SPI output
- Apply FFT on the vibration data to extract dominant frequencies
- Use a digital or analog low-pass filter to cut off frequencies above 20–25 kHz, reducing noise and preventing aliasing
- Analyze the FFT output for abnormal peaks → each peak can point to a specific fault type
Why Filtering is Important
Even in well-sampled systems, electrical and mechanical noise can cloud your signal. That’s where filters come in:
- Low-pass filters: Remove high-frequency noise
- Band-pass filters: Focus only on known fault frequency bands
- High-pass filters: Eliminate low-frequency drifts (e.g., from temperature changes)
Filtering before FFT leads to a cleaner spectrum, making fault detection more accurate.
Final Thoughts
Using FFT in predictive maintenance enables us to “see” inside machines — transforming raw vibration data into clear frequency signatures that reveal hidden faults before they escalate. But the real power emerges when FFT is combined with AI-driven analytics. By sampling at the right rate, applying smart filtering, and using machine learning models trained on historical fault data, we can not only detect issues early but also predict when and how failures are likely to occur.
This synergy of real-time signal processing and AI empowers businesses to make proactive decisions, optimize maintenance schedules, and avoid costly downtime.
Looking to develop your own intelligent vibration monitoring system? From high-performance sensors to real-time FFT and AI-based failure prediction, we can help you turn complex data into clear, actionable insights. Please contact: [email protected]